Methodology
WHAT IT IS
The Justice Snapshot is designed to accommodate a fast paced, risk-laden environment in which the criminal justice system has been severely eroded by conflict or disaster. Within a narrow time-frame (3 months), it engages with development partners and national authorities to produce a common evidence base for planning and costing early recovery in the justice system, while providing a monitoring and evaluation framework to measure progress.
Experience in Afghanistan, South Sudan and Somalia has shown that criminal justice data may be scattered, but they exist. The Justice Snapshot combines data collection, surveys and practitioner interviews within an accessible and easy-to-update website that anchors system stabilization in reliable baseline data and encourages national institutions to invest in data collection to inform and streamline priorities for early recovery.
The data are collected for a 12 month period against an agreed cut-off date. In this Justice Snapshot of Somaliland – comprising of Awdal, Saahil, Maroodi-Jeex, Togdheer, Sanaag and Sool – the data are for the year up to 31 December 2019, save the for the prison populations, which were registered on the date of visit, which were all in late 2020.
WHAT IT DOES
The Justice Snapshot sets in context the environment within which criminal justice operates. It depicts the way the justice system is designed to function in law, as compared with how it appears to function in practice; it captures the internal displacement of people due to conflict or environmental hazard, which could place unmanageable case volume pressures on the system; and it shows the money and external funding available to support the operation of the justice system. It provides a roadmap to proactively address extra-legal conditions that could limit and otherwise frustrate efforts to rebuild a national justice system.
The Snapshot provides a library of reference documents from the laws in effect to national policy documents and project papers and research / academic studies to provide a ‘go to’ resource. It enables users to cross check the data used in the visualisations with the source data in the Baseline.
Most importantly, it leaves national authorities and development partners with greater analytical and monitoring capacity than when it began. By embedding the vast array of information that has been collected, analyzed, and visualized within a website, which automatically regenerates new visualizations as new data are updated, the Snapshot establishes an increasingly accurate repository of data to inform both justice policy and the strategic interventions needed going forward.
WHY IT WORKS
It provides context, bringing together information about: what practitioners say about working in the justice system, as compared with what users of the system have to say about their experiences of it; the dislocation of large numbers of people; and the funding envelopes available to deliver justice generally and by institution. These data may better inform responses to provide justice and other social services where they are needed most.
Data measure impact, compiling data from the most elemental level of individual police stations, courthouses, and prisons to identify weaknesses or gaps in personnel, infrastructure, and material resources. This enables state planners and development partners to assess and address highly strategic building, equipping, and training needs and to monitor and evaluate incremental progress over time so as to scale up what works and remedy what does not.
It is accessible, quick and transparent, applying a tried and tested methodology and using live, interactive, updatable visualizations to accentuate nuances in data, instead of a static report; while signaling discrepancies through data notes and making all source data available to users.
It is collaborative and transferable, engaging the justice institutions from the beginning in collecting and analyzing their own data to stabilize justice system operations and enabling national authorities to take over administration and update of the Snapshot following initial implementation. It is objective and apolitical, generating a series of data-driven, accounts of the functioning of the justice system, ranging across security and migration to infrastructure/resources, case-flow and governance – and weaving them together to illustrate how the whole of a country’s criminal justice system is functioning, giving national authorities the tools to inform their interventions, rather than policy prescriptions.
HOW IT WORKS
The data are collected from each justice institution (police, prosecution, legal aid providers, judiciary, prison – and their line Ministries) with the consent of the principals of each institution and line Ministry. The data are owned by the respective institutions and are shared for purposes of combining them on one, shared, site.
The methodology applied in the Justice Snapshot derives from the Justice Audit. The Justice Audit is distinguished from the Justice Snapshot in that the former is designed to build upon a stable, peaceable national environment and serve as a health check of the criminal justice system. It engages with governments to embark jointly on a rigorous data collection, analysis and visualization process to better inform justice policy and reform.
As with the Justice Audit, the Justice Snapshot does not rank countries, nor score institutions. Instead, it enjoins justice institutions to present an empirical account of system resources, processes and practices that allow the data to speak directly to the stakeholder. The GJG and Justice Mapping have conducted Justice Audits at the invitations of the Malaysian and Bangladesh governments.
The data collected in the Justice Snapshot comprise a breakdown of each institution’s resources, infrastructure and governance structures – and track how cases and people make their way through the system. All data are, in so far as it is possible, disaggregated by age, gender and physical disability. And all data are anonymised and Personally Identifiable Information (PII) removed.
These administrative data are triangulated with surveys of justice practitioners (police and prison officers as well as prosecutors and lawyers) and court users (people coming to the courts for redress whether as defendants, victims, witnesses, or family members).
The baseline data sets are collected by independent research teams and enumerators under the guidance and with the support of the Justice Snapshot Steering Committee (JSSC) – members of which are nominated by their principals in each justice institution. Once the institutional data are collected, they are cleaned of obvious error. Any gaps in data are indicated ‘No Data’ unless the data show, for instance, 0 vehicles. Where the accuracy of data cannot be verified, or require further explanation, these are indicated in the ‘Data Note’ box. The clean data are then submitted to the JSSC for validation and signed off by the institutions concerned. The cleaned data sheets appear by institution in the Baseline Data as these are the data visualised throughout the Justice Snapshots.
Note: the data captured will never be 100% accurate. Gaps and error will occur especially in this first Justice Snapshot as those working on the frontline of the criminal justice system are not used to collecting data systematically and especially not on a disaggregated basis. However, data collection and accuracy will improve over time and as systems are embedded within each institution.
The data are then organized and forwarded to Justice Mapping to upload on to the Justice Snapshot web application which is programmed and coded to visualize the data as they are updated. Both the Justice Audit and Justice Snapshot are designed to be living tools rather than one-off reports. The purpose is to capture data over time and identify trends and so monitor more closely what works (and so scale up) and what does not (and so recalibrate or jettison).
The data identify investment options to sharpen budgetary allocations (and improve aid performance for ‘Better Aid’) and better join up justice services. These investment options are agreed in the final JSSC meeting with state level justice actors.
HOW DATA ARE UPDATED AND SUSTAINED
The engagement with key institutional actors at the outset is not just a courtesy. The methodology aims to maximize the participation of all actors and encourage them to invest in their own data collection better to inform policy for the sector as a whole and leverage more resources for their own institution. From the moment it is formed, the JSSC takes ownership of the process, and so is central to this approach.
Following this first series of Justice Snapshots, it is intended that each JSSC (and line ministries) will encourage their respective institutions to collect disaggregated data, at regular intervals, using standard data sheets. These data will be reported in line with existing procedures up the chain – and to an information management unit (IMU), or units, to conduct successive Justice Snapshots going forward at 1-2 year intervals to monitor change over time. The role of the GJG will be to provide backstopping and technical support as required.
THE JUSTICE SNAPSHOT TEAM
The Justice Snapshot team is headed up by Justice (retired) Johann Kriegler (founding Justice of the Constitutional Court of South Africa) and is managed by Radha Nair.
Allison Elders conducted the research and literature review for the Library from her base in the Bluhm Legal Clinic at Northwestern University School of Law, Chicago, USA supported by special adviser to the team, Tom Geraghty.
Transparency Solutions (TS), the organisation responsible for managing the research, is directed by Latif Ismail in Somaliland.
The Research team at Transparency Solutions was supported by practitioners in the GJG: Radha Nair, Kathryn English, Adam Stapleton, and a team of data analysts: Fergal Stapleton English, John Roy Ballossini Dommett, Thenjiwe Phillips, and Louis Stapleton English. This team of data analysts was also responsible for conducting research and contributing additional literature to the library, in preparation for the Snapshot.
The information technology and data design team is directed by Eric Cadora, founder and director, Justice Mapping (USA). He is supported by:
- Charles Swartz, IT Manager
- Andrii Ielbaiev, Computer Programming Engineer,
- Alexandra Dubow and Tatiana Temple, Data Visualization Designers, and
All translations into Somali from English were undertaken by Abdoulkarim Hassan (qurusdoon@yahoo.com).
Each Justice Snapshot followed a six-stage process:
- Planning
- Framing
- Collecting
- Interrogating
- Designing
- Validating
1. Planning
The coronavirus pandemic meant that the initial start-date of the Snapshot (March/April, 2020) was postponed by several months. Additionally, it played a large role when assessing whether the team could travel to Hargeisa to carry out the training (as well as affecting how the training was to be conducted). Much attention was paid to the threat that the team posed in traveling through and from Europe to Somaliland.
Other points of planning included:
- Review of institutional baseline data sets for Somaliland;
- Conduct cognitive and field tests of Court User and Practitioner Surveys;
- Check translation of all data sets and surveys;
- Reprogramme tablets;
- Initial work plan agreed with GJG partner, TS.
- TS data collection teams trained and deployed by November 22nd.
Designing the data collection tool
A review was conducted of available software. The team decided on Fulcrum Surveyor as it provided the necessary technological functionality. A review was also conducted of available tablets and Lenovo was selected after comparison of prices and functions.
An application was created for each institution and populated with fields informed by the baseline data. In line with these data, each application contained the seven dimensions across which data would be collected within each institution. These include: material resources, human resources, physical infrastructure, security and violence, case management, training and governance.
Response fields: Each application comprised of these seven sections, within which fields were created to cater to each question. Fulcrum offers multiple options with regards to the selection of the type of question, and so field to use, these include:
- Yes or No responses
- Numeric responses
- Multiple Choice
- Singular Choice
- Text field responses
Information section: Once the field was selected, each question was lettered and numbered, and supplementary information was included in the information section of each question. This segment was essential for a researcher seeking elaboration on the meaning of the question, and in guiding them towards the desired source of information.
Required: Another function offered by Fulcrum within each field is to make that question required. This prevents a record from being submitted until all required fields are complete. This was an important mechanism in ensuring that fields could not be accidentally skipped.
‘Other’ options: wherever there exists multiple, or singular choice question fields an ‘Other’ option was always provided. Selection of the ‘other’ field would trigger a pop-up which allowed for the insertion of text.
Translation: A corresponding translation table was created per application, which followed the lettering and numbering of each section and their respective fields. Each question was then inserted into a translation table (see below) comprising four columns (English label, Somali label, English description & Somali description). Once these tables were complete, they were cross-checked to make sure they were in-sync with the designed application. The translation of each question, and its description, source or drop-down options, were inserted in a separate column of the same row. Once received these were manually uploaded into the corresponding question in each application, so that each question was first in Somali and then repeated in English.
| English Label | Summadda Af Soomali | English Description | Faahfaahin Af Somaali |
| Date? | Taariikh? | – | – |
| Time? | Waqti? | – | – |
| Region? | Gobol? | – | – |
| District? | Degmada? | – | – |
| Town? | Magaalada? | ||
| A. Material Resources | A. Agabka | ||
| 1. Electricity supply? | 1. Adeegga Korontada/laydhka? | Interview. If partial ask how many hours per day. – None – Partial – Continuous – N/A | Waraysi Haddii qayb ahaan uu jiro weydii imisa saacadood maallintii. – Maba jiro – Qayb ahaan – Si joogto ah – N/A |
Manuals: Data Collection manual and Court user manual were developed to supplement the five day training course and act as guide to researchers in the field. Each manual was translated into Somali.
Institutional Surveys: An application was created for each institution and populated with fields informed by the baseline data. In line with these data, each application contained the seven dimensions set out above across which data would be collected within each institution. Data collected on courts were sourced from information in the public domain. The Chief Justice did not wish to participate, and therefore data collected on the courts has not been validated by a JSSC representative.
Notwithstanding the consent of the heads of the participating institutions and nomination of the JSSC, researchers gathering institutional data were required to inform each interviewee of the purpose of the data collection exercise and seek their consent before proceeding.
In total, 162 institutional surveys were conducted:
- Attorney General’s Office: 7
- Public Defender: 6
- Bar: 6
- Custodial Corps: 13
- Police (incl. RDC / DCP): 55
- NGO: 10
- District Court: 48
- Regional Court: 10
- Appeal Court: 6
- Supreme Court: 1
A shorthand survey of institutional surveys, the Functioning Justice Services survey was also taken. This survey prioritised settlements which researchers could not physically visit (the survey was carried out over the phone).
In total, 21 FJS surveys were conducted:
- Sool: 3
- Sanaag: 6
- Saahil: 1
- Awdal: 4
- Maroodi-Jeex: 3
- Togdheer: 4
Practitioner Survey: A single application was created for the practitioner survey. This application comprised three sections, the first two mainly populated with drop down multiple/singular choice options. The third, aiming at capturing the three main challenges of each respondent, consisted of three text fields. While for the institutional surveys the GPS was a necessary function, to safeguard against revealing personally identifiable information (PII) this was disabled in gathering practitioner survey data. Also categories were merged if maintaining them risked exposure. So for instance, Public Defenders are merged with Legal Aid Service Providers (LASPs) as there are only 5 PDs in the country.
In total, 257 Practitioner Surveys were conducted:
- Sool: 58
- Sanaag: 47
- Saahil: 48
- Awdal: 31
- Maroodi-Jeex: 35
- Togdheer: 38
Court User Survey:
A single application was created for the court user survey. This application enabled the researcher to conduct both court user surveys (in person), or GPS court location surveys (over the phone). The GPS location survey simply enabled a researcher to pinpoint the exact location of the District or Regional court. Researchers attended court on different days and focused on those using the first instance courts (namely, District and Regional Courts). The court user surveys first identified whether the researcher was at a district or regional court and then had seven distinct sections. The first captured the basic information of the respondent. The following six depended on court user type, each section covered questions relevant to different court users.
In total, 362 Court User surveys were conducted:
- Sool: 86
- Sanaag: 31
- Saahil: 48
- Awdal: 95
- Maroodi-Jeex: 53
- Togdheer: 49
The survey data are not representative. They point to possible further lines of enquiry. For instance the Court Users survey shows a number of transactions people make to access justice and the average costs paid to various gatekeepers based on the responses provided. How these break down are analysed in more detail in the Survey analysis (Word document) in the Baseline_Surveys section.
2. Framing
Training: a five-day training course was developed introducing the tablet and the fulcrum application. Much of this was technical:
- Basic tablet navigational ability
- Basic Fulcrum navigational ability
- Beginning new record
- Updating status of record
- Geo-tagging
- Using the (i) information button (elaboration on question & necessary source of data)
- Cases of no data, unverifiable data, or unreliable data (-99)
- Role and purpose of data notes (to provide additional or supplementary information)
- Attaching photographs
- Saving as draft
- Returning to draft
- Completing, saving and synchronising.
The training maximised participation and learning by doing. Researchers started at the outset with new tablets and learned how to navigate them. They then went through each institutional questionnaire and the seven dimensions across each. Researchers sourced data from interviews, registers/ledgers and observation. So when the person interviewed indicated a number of computers, the researcher asked for these to be pointed out and counted them; or when a person was asked for a percentage (say, of lawyers representing accused at trial), the answer was the person’s opinion (unverified); or when case figures were supplied, the researcher cross checked these figures in the relevant register, ledger, Occurrence Book as appropriate.
Ethical considerations were also discussed. Researchers were trained to obtain free and informed consent before any survey and the particularities involved during court user and practitioner surveys as well as taking photographs.
During the training, representatives of the Justice Snapshot Steering Committee (JSSC) members sat in on the training, in order to a) introduce the team members, b) agree to the workplan and c) ensure all institutions to be visited were notified in advance.
At the close of the training, the researchers planned their work in each location and GJG explained how the data cleaning was to proceed.
The TS team was trained in the Ambassador hotel in Hargeisa between 15-20 November 2020.The TS teams agreed to be in their respective regions by the 21st of November, and to start the data collection on the 22nd of November.
3. Collecting
The first JSSC Meeting (JSSC 1) was held to launch the data collection on 22 November 2020. The JSSC members then notified their institutions about the research: who would be coming to which institution, when and to request their cooperation and support.
This first meeting was important in conferring ownership of the data collection process to the institutions themselves as well as providing legitimacy to the teams engaged in data collection.
Data were collected in the field between: 22nd Nov – 18th December.
GJG Data Analysts (DAs) provided close support to the teams in the field. As data were collected and shared (in real time) with the DAs, they were able to check for obvious error, outlier and question why certain data fields recorded certain values, for instance ‘-99’ (ie ‘no data, or no reliable data’). Daily call-ins with the teams dealt with any questions or problems with sourcing data – and planned for the next day. It was agreed that any problems with accessibility should be referred to the team’s supervisor who could then follow up with the JSSC. There were no such problems in any of the locations and there was no need to call on this support.
The scheduling application ‘Notion.so’ was used to meet targeted collection dates and provide a comprehensive overview of outstanding issues.
Although the Chief Justice noted the importance of the Justice Snapshot, he declined to participate. The court data were obtained from multiple sources in the public domain.
4. Interrogating
The Fulcrum data were then exported (in Excel format) and GJG DAs checked the data for accuracy as well as internal consistency and completeness. The data cleaning process took place in January 2021. Data sets were sent to each institutional representative (in pdf) between 19-23 January 2021 to cross check and comment on. Comments were only received from the Custodial Corps.
JSSC 2 took place on 21 February 2021 when the JSSC formally validated the data sets by institution.
During the cleaning process, any changes to the raw data were saved to a new data cleaning file (the raw data file was left unchanged) and a note logging the change was inserted in a log file. By the time the data was ready for validation by the JSSC, it had been scrutinised by at least 4 sets of eyes (2 DAs, GJG team leader & research supervisor).
Methods employed during data cleaning
Cross-checking
The data cleaning process involved robust cross-checking standards that were applied to all institutional datasets. By the time data was ready for JSSC validation the record had been cross-checked, a minimum of, four times.
Institutional records were delegated to region-specific DAs as a first set of eyes (1SE). Once the 1SE had reviewed the record, a second DA (2SE) would review that same record. This allowed for 2SE to interrogate the cleaning process adopted by 1SE, highlighting any errors of that process. Once the record had reached the GJG team leader it had undergone a comprehensive clean, had received responses to any questions posed by 1SE and 2SE, and was ready for review.
At this stage of the cleaning process, the record was either finalised (no further cleaning action was required), or further cleaning issues and questions were identified and resolved with the help of 1SE, 2SE and TS. These questions / issues were then referred to the TS supervisor in Hargeisa to follow up and clarify or answer.
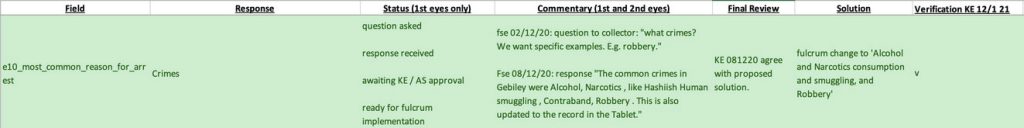
Colour-Coding
Colour coding was used to track status changes made during cleaning.
Yellow – flagged a potential problem.
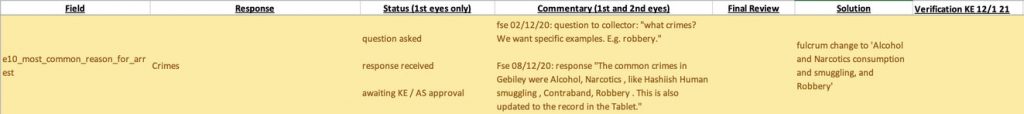
White – once the problem had been resolved, with no change required, the field reverted to white / neutral.
Green – once a changed field had been updated in the fulcrum database, the field was changed to green.
Geolocation cross-checking
Researchers were encouraged to include coordinates for each institution to assist with JM’s mapping processes. DAs ensured that geolocation coordinates placed the institution within the relevant vicinity of the town through source triangulation. The researcher and supervisor were consulted in the event of conflicting coordinates.
Responding to Feedback sent from GJG
GJG DAs framed a series of questions to the researchers through their supervisors. The answers or explanation to the questions were then entered in the ‘commentary’ cell.
Keeping track of changes
Whenever a change was made to an excel document, the date of this change was logged.
Inserting ‘Data Notes’
Where data lacked clarity / revealed discrepancies, or required more information or indication of source where this differed from interview, observation or institutional record, a Data Note has been inserted.
Adding Pictures submitted Separately (i.e. by Whatsapp)
Where researchers sent pictures separately or outside of Fulcrum, they were added to the record with appropriate captions within the record.
Creating JSSC Ready Documents for Validation
After all changes were implemented into the Fulcrum database and all PII was removed, the team generated a PDF report of the data and sent the compendium to the JSSC for validation.
5. Designing
Formatting the data
Institutional data
Codes were added to the data in the Excel files enabling front-end software developers to draw data from the database.
Practitioner Survey data
Original responses were translated, taking precaution to preserve original meaning. Following translation, coding was used to identify broader thematic sentiments / insights. The coding approach was inductive, allowing themes to emerge from the data, limiting preconceived notions to influence grouping.
The use of ‘Other’ reflects answers that indicated a misunderstanding of the question on behalf of the respondent or an unclear formulation (on behalf of the researcher).
Tableau visualisation software was then used to highlight findings for what practitioners said about safety in the workplace; conditions of their work environment; frustrations with their occupation; and joys of their occupation.
Court User Survey data
The Dataset (362 respondents) was downloaded as a raw file from the Fulcrum database. Given the sample size, data and findings presented are not intended as representations of national realities. Rather, they offer an insight into the choices as to justice pathways, gauge system confidence, and may help to inform subsequent research.
The cleaning process included, but was not limited to, currency conversions (SOS – USD); data note translations; totalling costs of justice; the creation of proxy variables; and standardising responses for text fields.
The analysis processes involved producing insights for baseline characteristic disaggregation; access to justice; case focus; system deliverables ‘will justice be served?’; costs of justice; and witness experience.
An in-depth analysis of the Court Users survey can be found in the Baseline_Court Users Survey and downloaded as a PDF document.
Investment Opportunities
The gaps revealed by the data were combined with institutional strategic plans and policy roadmaps to develop justice investment options around the type of investment (eg material resources), case process stage (eg complaint, arrest, trial), target institutions (eg Police) and Justice value added (eg Access to Justice).
Key Measures
The Key Measures were informed by institutional strategic plans, the National Development Plan II and the SDGs.
Site Design
The design was undertaken by Justice Mapping based on the previous Justice Snapshot South Central Somalia. Significant changes were required to the site and included:
- Crosschecking South Central with Somaliland to identify:
- Missing fields
- New fields
- Label changes
- Insertion of icons (i.e. Commentary Icon, Data Note Icon, etc)
- Relationships between values (i.e. total new cases bubble and types of disposition bubbles)
- Create excel file with relational tables between field labels and codes following the coding rules established.
- Create folder for developers to create the website’s backend database including:
- File with final data files for each type of institution (Excel format, labels in 1st row, identify version in document name)
- File with final picture files for each type of institution (jpg format)
- Name of pictures as exported from fulcrum relate the fulcrum IDs of records listed in “photos”, the 2nd sheet within each institution’s data file. This sheet acts as a correspondence table to link pictures with their respective location and caption.
File with additional information files (Excel format, labels in 1st row, identify version in document name) (I.e. Commentary Table; Monthly Shopping Basket; etc).
The Library was updated. The Commentaries were drafted to indicate sources of data, explain or provide context to the data and provide navigational tips.
Due to Ramadan and COVID 19 no JSSC could meet together to review the site. Direct presentations were made over ZOOM to the JSSC representative of the Minister of Justice on 11 April, followed by a presentation to the Director-General, MoJ on 15 April, and further presentation on 24 April to the representative of the AGO and Custodial Corps. A link to the Review site was shared with all JSSC members to digest and comment on.
6. VALIDATION (to be completed)